Visualizing Agent Movement
Agent movement in a geo-based coordination system can be visualized using Kepler.
How to generate a visual animation of simulation results
Enable an output to generate trips-layer convenient output, add the tag trips to your output of the desired type. MARS will create an trips.geojson file in your working directory, containing the trajectory data of your spatial objects.
{
  "agents": [{
    "name": "Citizen",
    "outputs": [{
      "kind":"trips"
    }]
  }]
}
Distinct objects
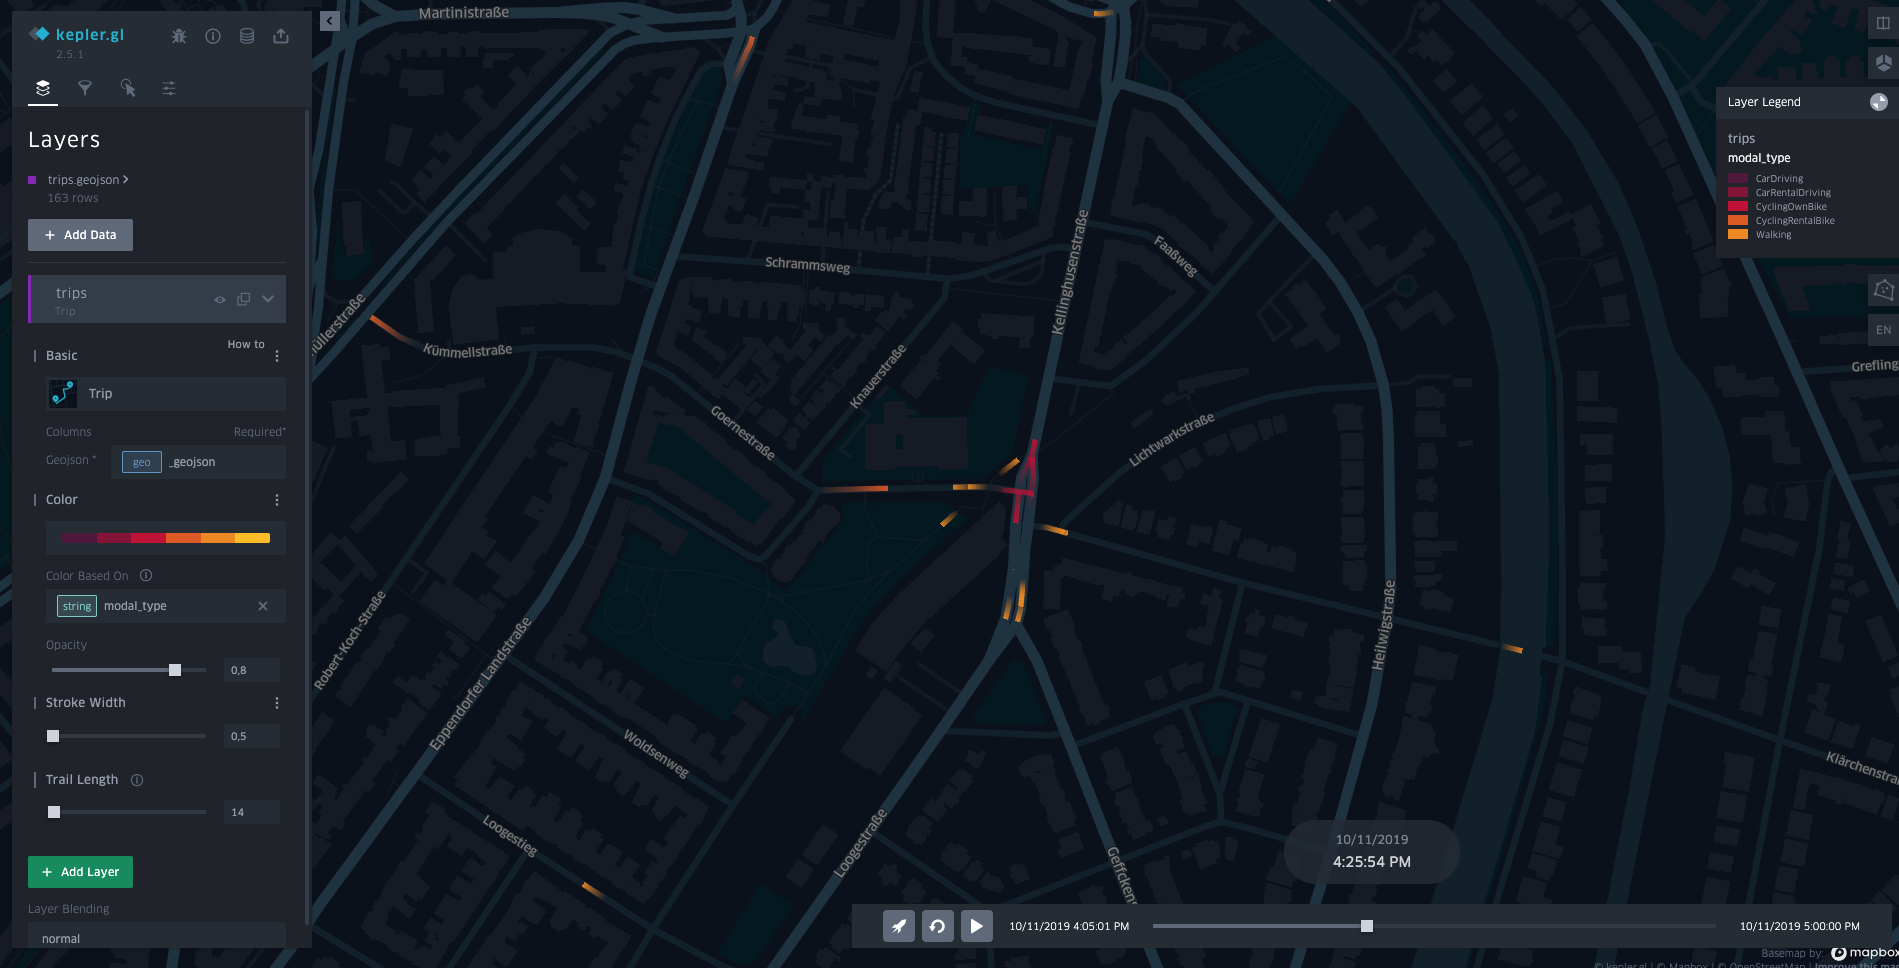
When you want to differentiate between multiple trajectories (e.g., using a different color based on given value) you can add string collection of tripsFields which will be added as property to respective trajectory. For example when agents provide a modal type, then trajectories can be visualized, highlighting their current modality.
{
  "agents": [{
    "name": "Citizen",
    "outputs": [{
      "kind":"trips",
      "outputConfiguration": {
        "tripsFields": ["ModalType"]
      }
    }]
  }]
}
Use kepler.gl and upload the generated trips.geojson The color can be configured by expanding the color tab, clicking on the three dots, select Color Based On.
