Simple Live Visualization
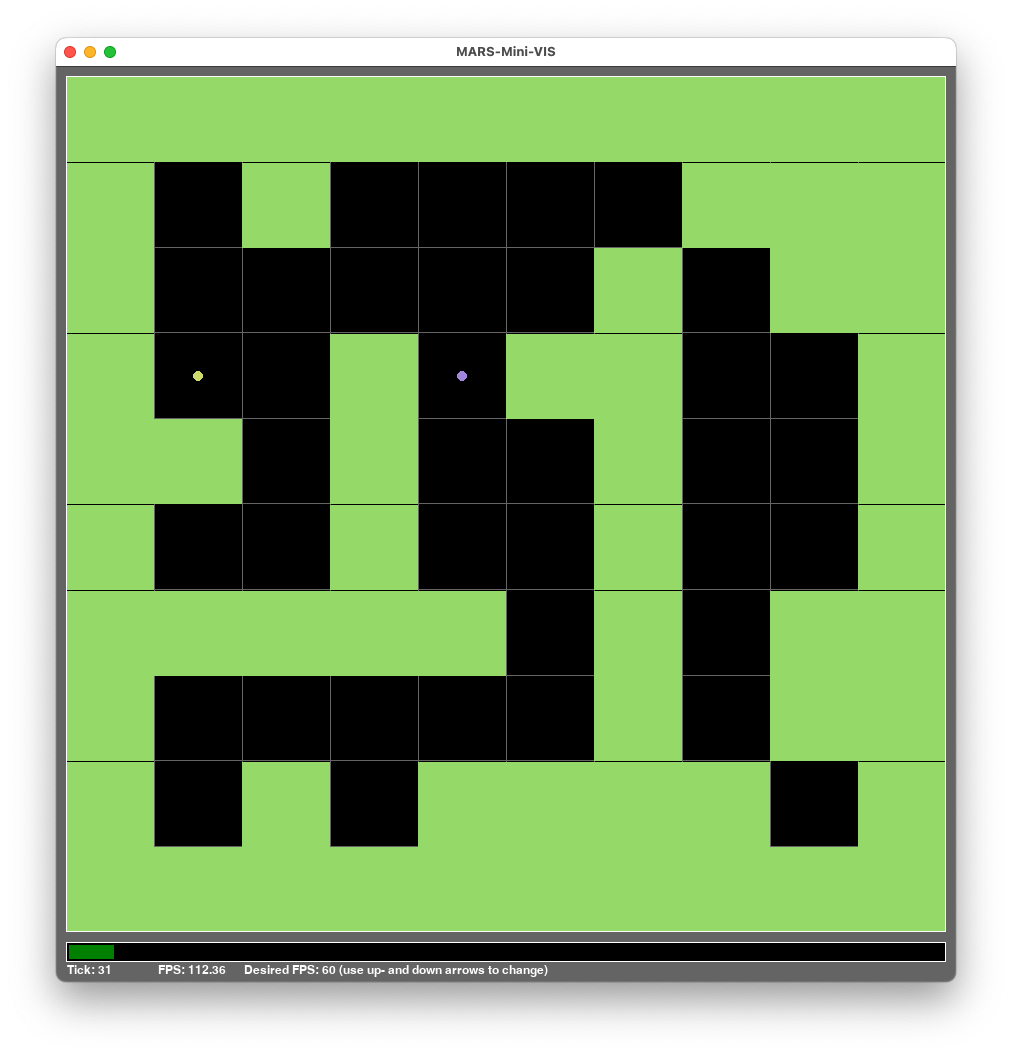
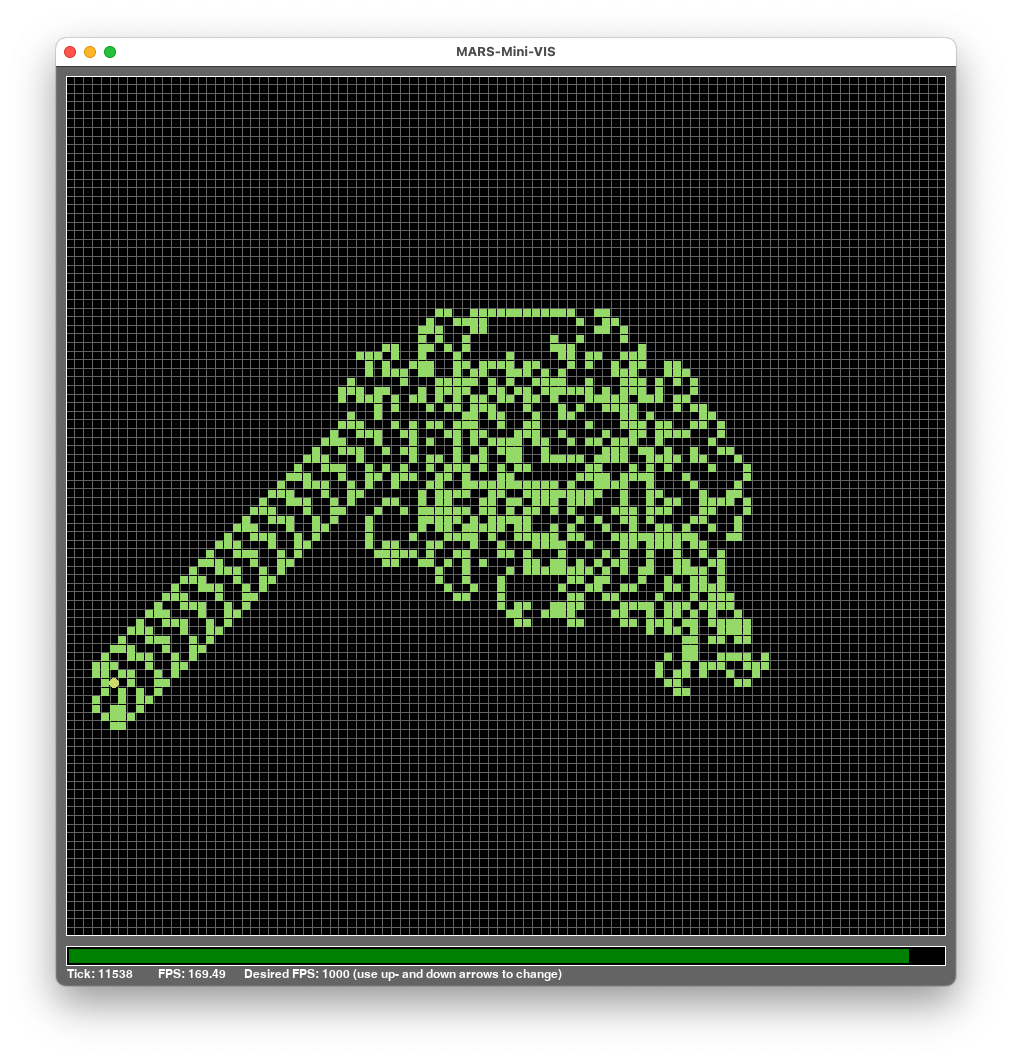
The MARS Simple Visualization is a small Python GUI to consume and visualize the MARS WebSocket output.
 |  |
|---|
To get this visualization it is necessary to make a few adjustments in the config.json. The following describes how exactly the installation and execution works.
Installation
The visualization tool can be found here. Please clone or download the repository and follow the installation instructions inside the README.
Once you have installed it and configured your model correctly you should be able to see your model in real-time.